|
Thursday, 23 October 2025
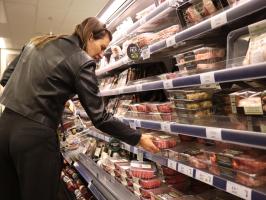
quote [ Are retailers using AI to access customers' personal data and set higher prices for those they think will pay more? ]
Well, the price of groceries goes up every day
|
Paracetamol said @ 8:30am GMT on 24th October
interesting tabular script – since you have a script to sum thouse up already I'd recommend outputting an SVG element:
you can hack pie pieces together by drawing transparent circles with an outline that's double the radius and use dashed outline settings to offset them according to their position/size, like this:
Note that by using
pathLength you don't even need to do pi calculations, you only set the dasharray-values (1. dash 2. gap) in a way, that the dashes add up to 100 and add an offset on the later pies.
Paracetamol said @ 8:31am GMT on 24th October
interesting tabular script – since you have a script to sum thouse up already I'd recommend outputting an SVG element:
you can hack pie pieces together by drawing transparent circles with an outline that's double the radius and use dashed outline settings to offset them according to their position/size, like this:
Note that by usingpathLengthyou don't even need to do pi calculations, you only set the dasharray-values (1. dash 2. gap) in a way, that the dashes add up to 100 and add an offset on the later pies.
Note that by using
pathLength you don't even need to do pi calculations, you only set the dasharray-values (1. dash 2. gap) in a way, that the dashes add up to 100 and add an offset on the later pies.
Paracetamol said @ 8:34am GMT on 24th October
interesting tabular script – since you have a script to sum thouse up already I'd recommend outputting an SVG element:
you can hack pie pieces together by drawing transparent circles with an outline that's double the radius and use dashed outline settings to offset them according to their position/size, like this:
<svg xmlns="http://www.w3.org/2000/svg" height="240" width="240" version="1.1" viewBox="0 0 240 240" stroke-width="120" fill="transparent">
    <circle cx="120" cy="120" r="60" stroke="red" pathLength="100" stroke-dasharray="75 25"></circle>
	<circle cx="120" cy="120" r="60" stroke="green" pathLength="100" stroke-dasharray="25 75" stroke-dashoffset="-75"></circle>
</svg>
Note that by using
pathLength you don't even need to do pi calculations, you only set the dasharray-values (1. dash 2. gap) in a way, that the dashes add up to 100 and add an offset on the later pies.
Paracetamol said @ 8:34am GMT on 24th October
interesting tabular script – since you have a script to sum those up already I'd recommend outputting an SVG element:
you can hack pie pieces together by drawing transparent circles with an outline that's double the radius and use dashed outline settings to offset them according to their position/size, like this:
<svg xmlns="http://www.w3.org/2000/svg" height="240" width="240" version="1.1" viewBox="0 0 240 240" stroke-width="120" fill="transparent">
    <circle cx="120" cy="120" r="60" stroke="red" pathLength="100" stroke-dasharray="75 25"></circle>
	<circle cx="120" cy="120" r="60" stroke="green" pathLength="100" stroke-dasharray="25 75" stroke-dashoffset="-75"></circle>
</svg>
Note that by using
pathLength you don't even need to do pi calculations, you only set the dasharray-values (1. dash 2. gap) in a way, that the dashes add up to 100 and add an offset on the later pies.
<-- Entry / Current Comment
Paracetamol said @ 8:30am GMT on 24th October [Score:1 Hot Pr0n]
interesting tabular script – since you have a script to sum those up already I'd recommend outputting an SVG element:
you can hack pie pieces together by drawing transparent circles with an outline that's double the radius and use dashed outline settings to offset them according to their position/size, like this:
<svg xmlns="http://www.w3.org/2000/svg" height="240" width="240" version="1.1" viewBox="0 0 240 240" stroke-width="120" fill="transparent">
    <circle cx="120" cy="120" r="60" stroke="red" pathLength="100" stroke-dasharray="75 25"></circle>
	<circle cx="120" cy="120" r="60" stroke="green" pathLength="100" stroke-dasharray="25 75" stroke-dashoffset="-75"></circle>
</svg>
Note that by using
pathLength you don't even need to do pi calculations, you only set the dasharray-values (1. dash 2. gap) in a way, that the dashes add up to 100 and add an offset on the later pies.