How to Create a Mind -
The Secret of Human Thought Revealed
|
Thursday, 23 October 2025
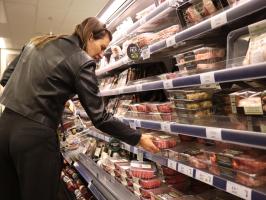
quote [ Are retailers using AI to access customers' personal data and set higher prices for those they think will pay more? ]
Well, the price of groceries goes up every day
|
Comments
|
R1Xhard said[2] @ 4:27am GMT on 24th Oct
Would not surprise me. Hell I reckon there's Bosses out there that would charge you for the privilege of working for them.
Keeping track of the Mean price in Australia of basic shopping price for this site over the last 40 weeks or so. Justifying collection process. Firstly, Getting the price from the retailers digital store front without Geo-tracking or cookie Data. (usually load for items at a time in TABs collate to spreadsheet and edit changes, I find it ironic Coles lets me load 2 pages then Accuses/suspects me of being a Robot - hell I'm trying not to break ROBOT.txt ~ hell the Google Engineer looked a little worried when I mentioned that I was doing it manually and if I really wanted to script it couldn't I just Beautiful Soup Google Searches and scrape the price data from there; without even touching anything but a search box?) If anyone's decent at making a nice Pie Chart or such, I got some comparative pricing over the last 40 Weeks in CSV. Surprisingly not all products increase in price some have reduced, not talking tomatoes and potatoes but Staples like Salt. Also observed how it took the media a fortnight to reflect on the increase in Milk and Bread at Coles & Woolies a few months ago, but how they don't present the reduced prices of items from Black & Gold at IGA. Bias in the bad news gets more press then good news? |
|
Paracetamol said[4] @ 8:30am GMT on 24th Oct
[Score:1 Hot Pr0n]
interesting tabular script – since you have a script to sum those up already I'd recommend outputting an SVG element:
you can hack pie pieces together by drawing transparent circles with an outline that's double the radius and use dashed outline settings to offset them according to their position/size, like this: <svg xmlns="http://www.w3.org/2000/svg" height="240" width="240" version="1.1" viewBox="0 0 240 240" stroke-width="120" fill="transparent">Note that by using pathLength you don't even need to do pi calculations, you only set the dasharray-values (1. dash 2. gap) in a way, that the dashes add up to 100 and add an offset on the later pies. |
|
R1Xhard said @ 11:43am GMT on 24th Oct
Sure you were implying something else, but been brainstorming a revamp for the site (been planning for Halloween - then Youtibe and BOM updated with the same sort of CSS I've been tweaking....so) and reading that gave me an idea to present the data differently in a "Gamified" way {Interactive Pie Charts}. Was wanting to find a reason to dip the toes into Mobile and a glorified Webpage in Android and a work around (in test beds) for Apple to display the Ticker Tape Telnet as a scrolling notification bar, just under the top bar was my thoughts never really liked. But a gamified shopping list, maybe.
But also gives me some ideas on free floating ovals as interaction prices. Anyway thanks for the train of thought. |
|
Paracetamol said @ 11:50am GMT on 24th Oct
Note that using this technique, you can CSS-animate the dashes for chart transitions, if you want an even fancier element.
|
|
R1Xhard said[2] @ 2:14pm GMT on 24th Oct
Always enjoyed something nicely rounded, but the more I age the more I appreciate a nice curve.
Question is which one? A) {svg xmlns="http://www.w3.org/2000/svg" width="240" height="240" viewBox="0 0 240 240"} {defs} {filter id="drop-shadow" x="-20%" y="-20%" width="140%" height="140%"} {feDropShadow dx="2" dy="2" stdDeviation="3" flood-color="#000" flood-opacity="0.4"/} {/filter} {/defs} {path d="M 120 20 Q 220 20, 220 120 Q 220 220, 120 220 Q 20 220, 20 120 Q 20 20, 120 20 Z" fill="crimson" filter="url(#drop-shadow)" /} {/svg} B) {svg xmlns="http://www.w3.org/2000/svg" width="300" height="200" viewBox="0 0 300 200"} {defs} {filter id="drop-shadow" x="-20%" y="-20%" width="140%" height="140%"} {feDropShadow dx="2" dy="2" stdDeviation="3" flood-color="#000" flood-opacity="0.4"/} {/filter} {/defs} {path d="M 150 20 Q 270 20, 270 100 Q 270 180, 150 180 Q 30 180, 30 100 Q 30 20, 150 20 Z" fill="darkorchid" filter="url(#drop-shadow)" /} {/svg} C) {svg xmlns="http://www.w3.org/2000/svg" width="300" height="150" viewBox="0 0 300 150"} {defs} {filter id="drop-shadow" x="-20%" y="-20%" width="140%" height="140%"} {feDropShadow dx="2" dy="2" stdDeviation="3" flood-color="#000" flood-opacity="0.4"/} {/filter} {/defs} {path d="M 150 25 Q 287.5 25, 287.5 75 Q 287.5 125, 150 125 Q 12.5 125, 12.5 75 Q 12.5 25, 150 25 Z" fill="mediumseagreen" filter="url(#drop-shadow)" /} {/svg} |
Post a comment
[note: if you are replying to a specific comment,
then click the reply link on that comment instead]You must be logged in to comment on posts.